
 中文简体
中文简体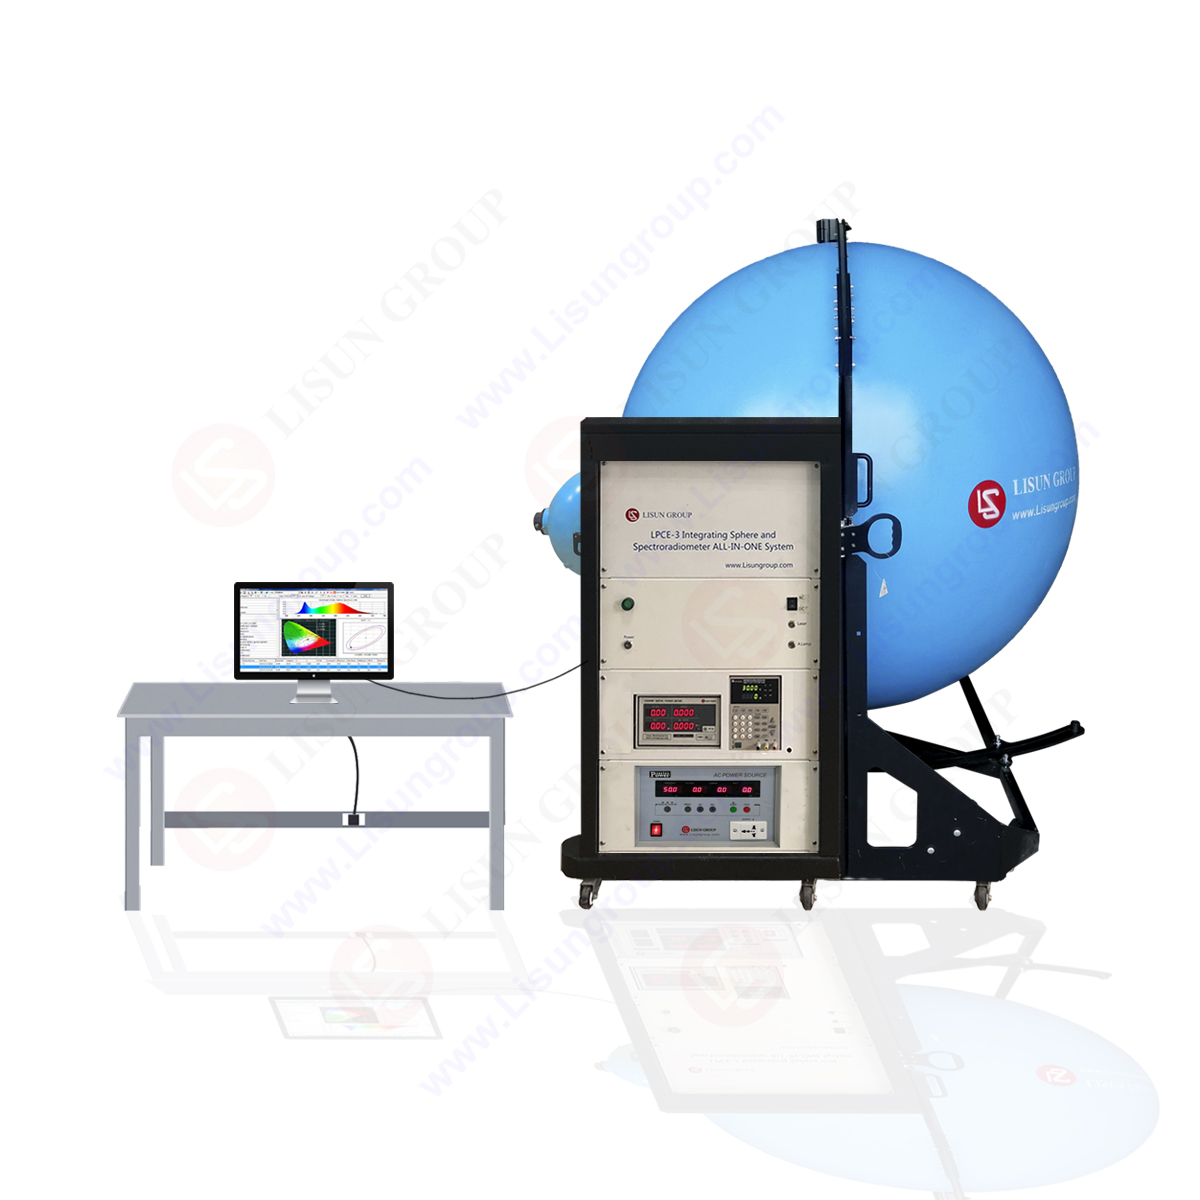

IES test is mainly used for lighting designer to simulate illumination. It reflects the photometric performance of lamps in three-dimensional space.

IES light distribution file test
IES test includes:
Actual power, actual current, PF value, total luminous flux, luminous efficiency, peak luminous intensity, upper luminous flux ratio, lower luminous flux ratio, average beam angle, spatial isoluminance curve, annular luminous flux of lamps, working face utilization coefficient and lamp budgetary estimate curve, wall and ceiling utilization coefficient, UGR (UnifiedGlareRating) data sheet, UF utilization coefficient table, lamp isoluminance curve, lamp effective average illuminance diagram, plane isoluminance curve, Average brightness data table (CIBSE), plane illuminance curve, light intensity distribution data table, etc,
Definition of IES light distribution curve test:
It refers to the light intensity distribution of light source (or lamp) in all directions of space.
Representation method of IES test light distribution curve test:
Polar coordinate method, rectangular coordinate method, and equal light intensity curve.
Polar coordinate light distribution curve A:
On the light measuring plane passing through the center of the light source, measure the light intensity values of the lamps at different angles. From a certain direction, the light intensity of each angle is marked with a vector using the angle as a function. The connection at the top of the connection vector is the polar coordinate light distribution curve of the lighting fixture. If the lamp has a rotational symmetry axis, the light intensity distribution curve on a metering surface passing through the axis can be used to describe the spatial distribution of its light intensity. If the light distribution of the lamp in space is asymmetric, the light intensity distribution curve on several metering planes can be used to describe the spatial distribution of its light intensity.
Polar coordinate light distribution curve B, rectangular coordinate light distribution curve:
For spotlight lamps, since the beam is concentrated in a very narrow spatial solid angle, it is difficult to express the spatial distribution of light intensity with polar coordinates. Therefore, it is necessary to use a right angle from the light distribution curve to represent the light intensity diagram I with the vertical axis and the projection angle of the beam with the horizontal axis. For lamps with symmetrical rotating axis, only one light distribution curve is required, and for asymmetric lamps, multiple light distribution curves are required.
Rectangular coordinate light distribution curve C, light intensity curve:
The curve connecting the top of vectors with equal light intensity is called equal light intensity curve. The values of adjacent equal light intensity curves are arranged in a certain proportion. A series of equal light intensity curves are drawn to form a graph called equal light intensity graph. The commonly used graphs are circular grid, rectangular grid and positive arc grid. Since the rectangular network diagram can not only describe the light intensity distribution of the lamps, but also the regional distribution of light quantity, the current equal light intensity curves used for projection lamps are rectangular network diagrams.
The IES generated file report includes:
Spatial light intensity distribution curve, light distribution curve, luminous efficiency (lm/W), light intensity data, regional luminous flux, lamp efficiency, utilization coefficient, brightness limit curve, glare level, budgetary estimate curve, maximum allowable distance ratio, effective luminous angle, upper luminous flux, lower luminous flux, iso illuminance s curve, iso luminous intensity curve and other photometric parameters, as well as voltage, current, power Power factor and other electrical parameters.
LISUN lauched LSG-1890B/LSG-1800A goniophotometer is automatic goniophotometric instrument for luminous intensity distribution measurements with facility for rotating the light source. The LSG-1890B/LSG-1800A uses a constant temperature detector, Japanese motor and German precision angle coder which keep the test results with high accuracy. It is for industrial laboratory photometric data measurement of all kinds of luminaries such as LED luminaries, HID lamps, fluorescent lamps and so on.

High Precision Rotation Luminaire Goniophotometer LSG-1890
LSG-1890BCCD/LSG-1800ACCD goniospectroradiometer is high precision automatic goniophotometric instrument for luminous intensity distribution measurement with facility for rotating the light source. The LSG-1890BCCD/LSG-1800ACCD can do the spatial CCT test and the intensity distribution test. It is for industrial laboratory photometric data measurement of luminaires such as LED luminaires, LED Plant Lighting, HID luminaires, fluorescent lamps and so on.

LSG-1890BCCD High Precision Rotation Luminaire Goniospectroradiometer
Lisun Instruments Limited was found by LISUN GROUP in 2003. LISUN quality system has been strictly certified by ISO9001:2015. As a CIE Membership, LISUN products are designed based on CIE, IEC and other international or national standards. All products passed CE certificate and authenticated by the third party lab.
Our main products are Goniophotometer, Integrating Sphere, Spectroradiometer, Surge Generator, ESD Simulator Guns, EMI Receiver, EMC Test Equipment, Electrical Safety Tester, Environmental Chamber, Temperature Chamber, Climate Chamber, Thermal Chamber, Salt Spray Test, Dust Test Chamber, Waterproof Test, RoHS Test (EDXRF), Glow Wire Test and Needle Flame Test.
Please feel free to contact us if you need any support.
Tech Dep: Service@Lisungroup.com, Cell/WhatsApp:+8615317907381
Sales Dep: Sales@Lisungroup.com, Cell/WhatsApp:+8618117273997