In daily life, we can see the various, such as red, yellow, blue, white light. The sun light through the three prism will produce red, orange, yellow green, green, blue, purple aligned ribbons, and light people are invisible to if with the naked eye such as ultraviolet, infrared, gamma ray.
From the viewpoint of spectral analysis, important spectral line wavelength is in 100 – 12000*10-1nm, this interval is divided into several spectral ranges. Tell from broad sense, all kinds of electromagnetic radiation are spectrum, generally according to its wavelength can be divided into: gamma ray 0.00005 – 0.14nm X ray 0.01- 10nm 0.3mm – LMM microwave spectroscopy and spectral region can be divided into: vacuum ultraviolet 10 – 200nm near ultraviolet visible spectral region from 200 to 380nm 380 – 780nm near infrared spectroscopy of 3 μ m far infrared spectra of 3 – 300 μ M
Note: 1 meters (m) =103 mm (mm) (μ m)=106 micron photoelectric, direct reading spectrometry application element wavelength, mostly in the vacuum ultraviolet and near ultraviolet region.
The spectrum we usually mentioned only refers to the optical spectrum, three types of spectroscopy obtained from substance (solid, liquid, gas) heating or light or electricity stimulated emission spectra.
Line spectrum is obtained from the excitation of atoms or ions which are in gas condition, usually presents with discrete linear so that also called light, according to the methods that it produced it can be divided into emission spectroscopy (open-wire line) and absorption (dark line), so the spectrum analysis is divided again for emission spectrum analysis and atomic absorption spectroscopy analysis. If the spectrum was excited by atomic, known as atomic spectroscopy, if the spectrum produced by the excitation of ions known as ion spectroscopy. Banding spectrum is the atomic structure of synthetic molecules set out of with one or more than two atomic group issued, usually with zonal distribution, produced molecular spectroscopy, such as using carbon electrodes in spectrum analysis, at high temperature, carbon and nitrogen in air to generate cyanide compound with (CN) molecule, spectra generated when cyanide molecules excited in arc, called cyanogens band. Continuous spectrum is obtained from an incandescent solid issued; it is in a special state that atoms distributed, so the continuous spectrum is the composite of infinite number of line spectrum and spectra.
Usually what we talk about spectral analysis, generally refers to the “atomic emission spectral analysis”, the wavelength in photoelectric spectral analysis of elements are elements of atomic spectroscopy and ion spectra.
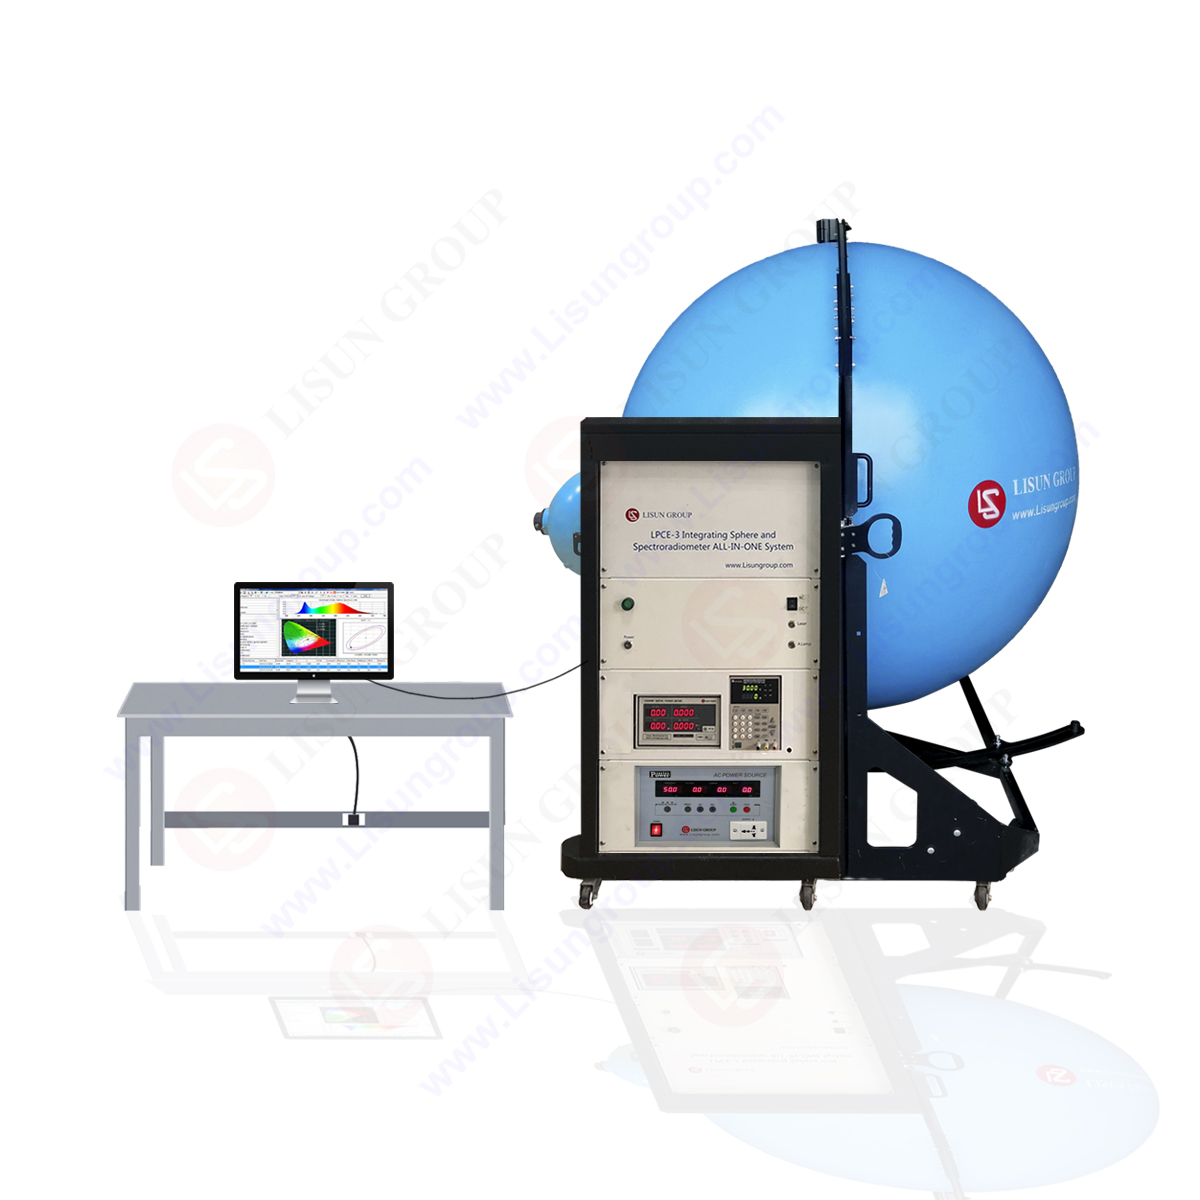
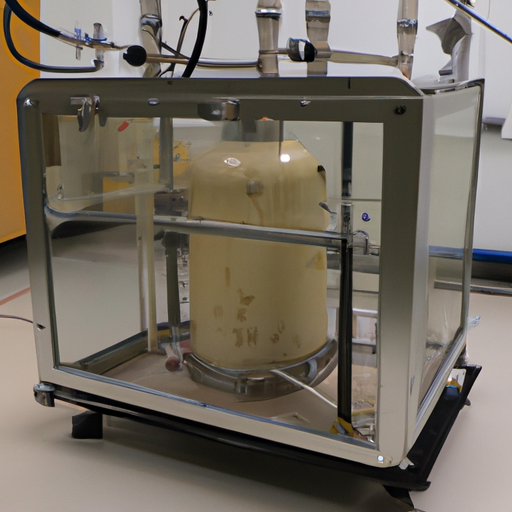
Nowadays photoelectric spectrometer is mainly divided into two categories. The operating wavelength range of vacuum type photoelectric spectrometer is in the near of ultraviolet and visible region. Vacuum photoelectric spectrometer wavelength extended120.0nm far of vacuum ultraviolet, so use the carbon, nitrogen, phosphorus, and sulfur of band and other spectral sensitivity to analysis the important elements of steel.
Tags:Spectrometer
 中文简体
中文简体


