Illuminance and Luminance
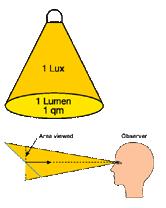
Illuminance is another quantity derived from intensity which denotes luminous flux density. It has a special name, lux, and is lumens per square meter, or lm/m2. The symbol is Ev. Most light meters measure this quantity, as it is of great importance in illumination engineering. Some examples for typical illuminances range from 100,000 lx for direct sunlight, or 500 lx on a working desk in office to 20-50 lx for hospital corridors at night and 1 lx for emergency lighting.
Luminance (luminance meter) is analogous to radiance, differentiating the lumen with respect to both area and direction, and is measured in cd/m2. The symbol is Lv. It is most often used to characterize the “brightness” (brightness meter) of flat emitting or reflecting surfaces.
Luminance is the only photometric quantity that can be visually seen by human beings (except starlight). Lighting as well as illuminated surfaces (depending on their reflectance) have a certain luminance. Examples for luminance:
– Open window a little cloudy: 5,000-50,000 cd/m2
– Opal incandescent bulb 100 W: 60,000 cd/m2
– White sheet of paper, illuminated 500 lx: 130-150 cd/m2
Fig. 2: Luminous Quantities
Colorimetry
Colorimetry is based on the fact that observers can match colors with additive mixtures of three reference stimuli in amounts known as tristimulus values. Using reference stimuli at specified wavelengths, CIE has defined a standard set of tristimulus values to match each different wavelength of the spectrum. These data constitute the CIE 1931 (what is CIE1931?) standard colorimetric observer. The reference-color stimuli are radiations of wavelength 700 nm for the red stimulus (R), 546.1 nm for the green stimulus (G) and 435.8 nm for the blue stimulus (B).
The tristimulus values were chosen to match the typical white color. There is a great imbalance in the three amounts (the amount of green being the greatest and the amount of blue being much smaller). As white is a color that is not biased towards red, green, or blue, new relative units of R and B were chosen so that the amounts are equal to the amount of green.
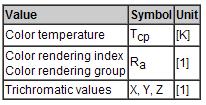
Series of measurements have been carried out with the standard colorimetric observer to find the different tristimulus values for different colors. To make use of the huge resulting data file, CIE has worked up a specific “map” of colors. As three stimuli are assigned to each color, a three-dimensional coordinate system would have been needed to plot the actual coordinates. To simplify this representation (at the expense of losing the lightness information), coordinate transformation and some other calculations have been done, resulting in a two- dimensional chart called chromaticity diagram. In spite of this, the suitability of the diagram for all colorimetric measurements without the need of the related mathematical apparatus gives the chromaticity diagram an outstanding importance (see Fig. 3).
Fig. 3: Luminous Color
About Lisun Group:
Lead in CFL and LED Tester. Click to our product lists:
Goniophotometer
Spectroradiometer
Integrating Sphere
Colorimeter and Photometer
LED Test Instruments
CFL and CCFL Tester
EMC testing
Electronic Ballast Tester
Equipments for Testing Electronic components
Electrical Safety Tester
Environmental Chamber
AC and DC power supply
Spectrophotometer

 中文简体
中文简体
