
 中文简体
中文简体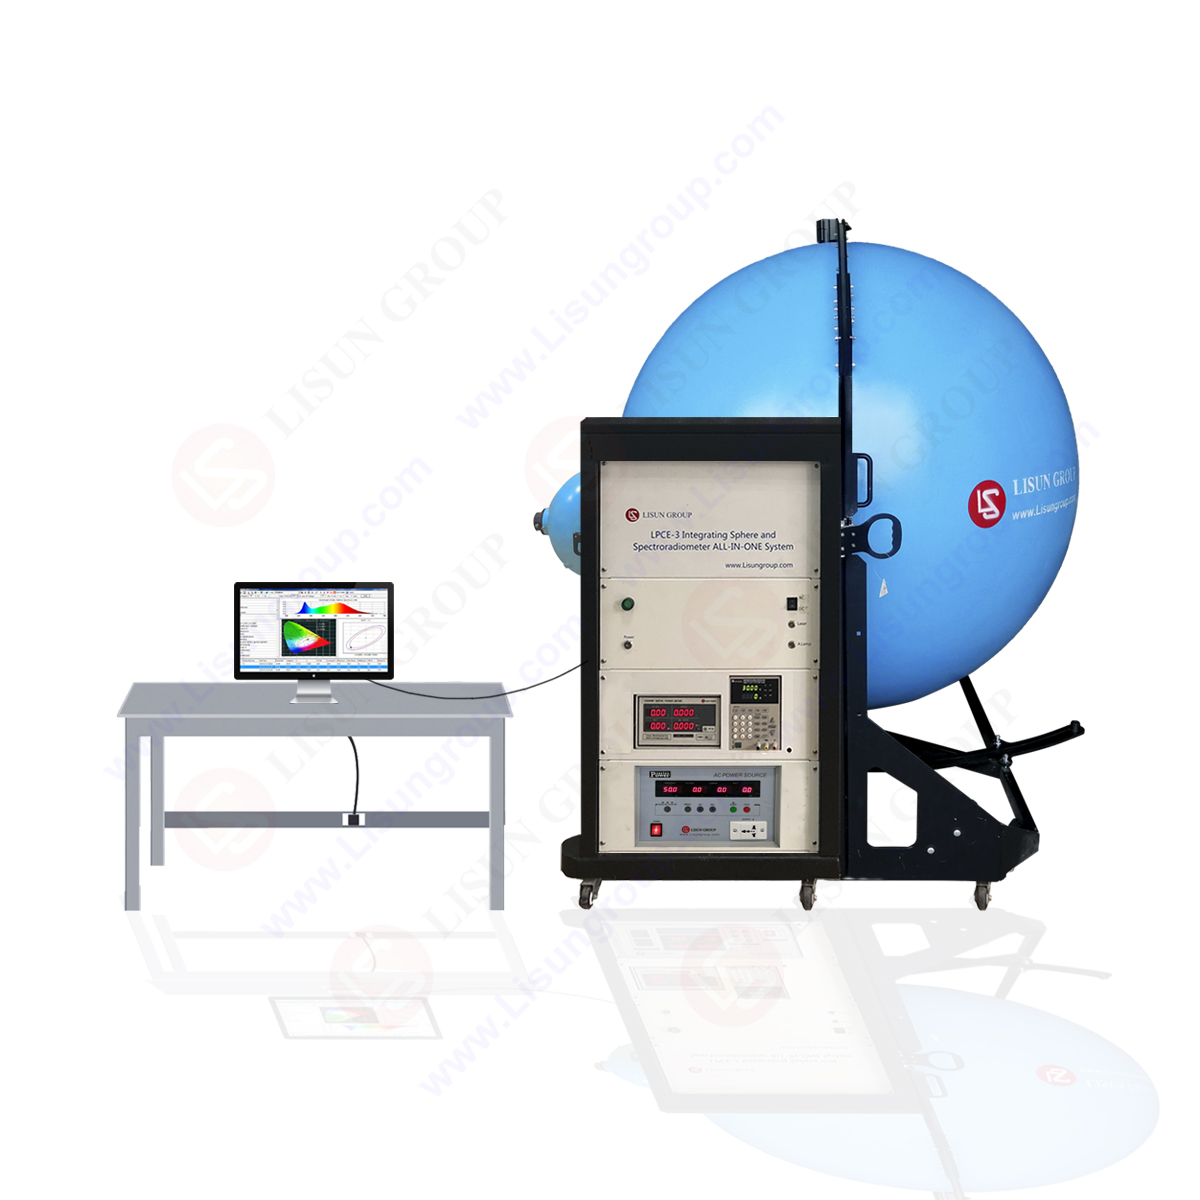


According to the vibration theory of the two kinds of transparent medium interface, a beam of light will be decomposed to p component running parallel to r incident plane and the s component perpendicular to the incident plane. During the process of reflection and refraction, the vibration of the two components p and s is independent of each other. According to Fresnore fraction formula, the photon transmissivity of component p and s is not the same during the refraction process,therefore,we should calculate separately.
According to above model, the photon overflowed from the cone, the light distribution is rotational symmetry. Therefore, as long as we select any flat surface of the optical axis, and calculate the light distribution from 0 to 90 degrees, we can get the light intensity curve of the whole space.
The photon emitted from p-n junction to the resin interface, because of the existence of the reflection angle, the scope of the incidence angle i is among 0-I, but the emergence angle i2 is -901. The specific calculation process is as follows:
(1)Divide the emergence angle i2 into 90 parts according to the proportional of Δi2=i0;
(2) From the refraction formula, we can conduct the incidence angle i that is correspond to every emergence angle;
(3) According to Fresnel photon transmissivity formula, we can respectively work out the photon transmissivity of p,s component that is correspond to every angle.

(4) Take the luminous intensity (photon density) of p-n junction as the unit volume1, and then the output light intensity is

(5) Calculate the relative values WP, Ws of the output light intensity of the angle on the base of angle of departure. Work out their average value w and the relative intensity WP, W, and the congruent relationship of the average value W and angle i2, w we can get the relatively light intensity distribution curve, and compare the average value curve and the cosine value, seen as figure 4. Seen from figure 4, the relatively light intensity average value curve basically corresponds with the cosine distribution.

Figure 4 the relatively light intensity distribution curve under the system of rectangular system
If X,= W *cos i; Y=W*sin i, and y is the ordinate value, x is the abscissa value, we can get the distribution curve between 0-9 under the polar coordinate. Seen from figure 5, if we copy it around, we can get the distribution curve flux from -90-90 degrees.
About Lisun Group:
Lead in CFL and LED Tester. Click to our product lists:
Goniophotometer
Spectroradiometer
Integrating Sphere
Colorimeter and Photometer
LED Test Instruments
CFL Testing Instruments
EMC testing
Electronic Ballast Tester
Equipments for Testing Electronic components
Electrical Safety Tester
Environmental Chamber
AC and DC power supply
Spectrophotometer